
Explore coffee origins with confidence
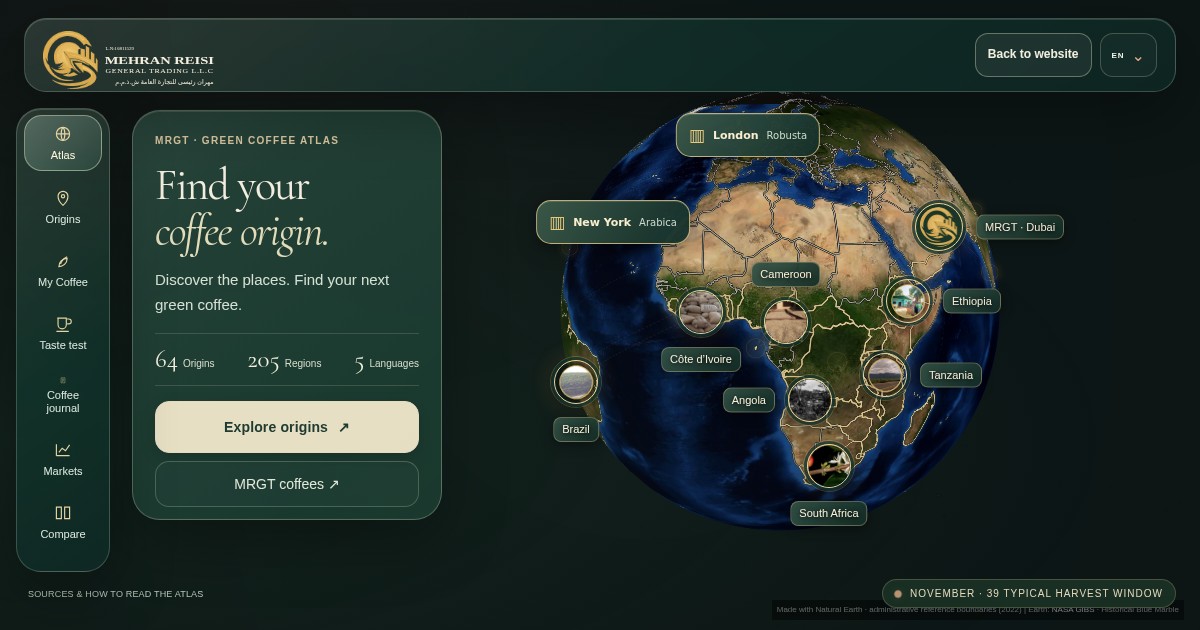
MRGT Coffee Atlas brings together 64 origins and 205 producing regions in an interactive map. Use it to explore regional context before discussing the specification of a particular green coffee lot.
How to compare origins
- Choose an origin and a producing region. Read the profile before comparing it with another region.
- Compare the available information on growing area, altitude, processing, typical harvest window and cup character. Record which details still need confirmation for the proposed lot.
- For a buying decision, request a representative sample and written lot specifications, packing, availability and delivery terms from the supplier.
How many coffee origins and regions does the atlas cover?
The current atlas presents 64 origins and 205 producing regions. It offers an educational overview of the global coffee landscape. MRGT’s commercial supply range is confirmed separately for each enquiry.
How should I use regional harvest and flavour information?
Harvest windows and flavour descriptions provide regional context. Timing can vary with elevation, rainfall, variety and crop year. Individual farms and lots can have different cup characteristics. Confirm the harvest, processing and sample of the actual lot.
Which year do the coffee trade figures describe?
The annual movement profiles use 2024 bilateral records for HS 090111 where available. Reporter exports are preferred and partner-reported imports are identified when used. Read these as country-level gross trade flows. Re-exports and reporting revisions can affect the totals.
Can I use a map location or trade figure as a shipment specification?
Coordinates describe general producing areas and some regions use representative points. Annual trade volumes are country-level figures. For a shipment, confirm the actual origin, region, lot, loading quantity and destination with the supplier.
Data and methodology
The explanations here follow the Sources & how to read the atlas panel in the interactive map. The underlying trade period remains 2024. Guide updated 19 November 2026.